08-02-2022
Designing heat stress specific primers for Mytilus trossulus/edulis…
Previous primers used in class lab were from this paper: DNA Damage and Transcriptional Changes in the Gills of Mytilus galloprovincialis Exposed to Nanomolar Doses of Combined Metal Salts (Cd, Cu, Hg)
Primers might not have been appropriate for heat stress since the study was directed more toward metal toxicity. The mussel species may have also been too dissimilar from those we used (primers were for galloprovincialis rather than trossulus or edulis).
Hsp70s gene expression:
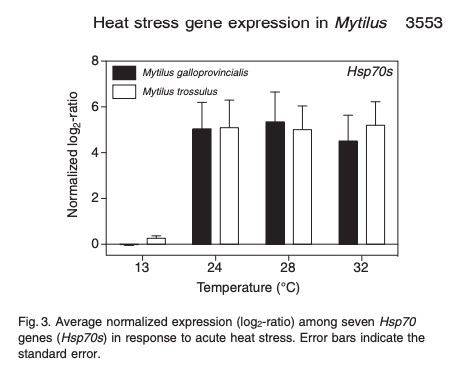
Need to look a little closer at some of the figures to get species specific genes that saw up-regulation in trossulus and continue lit review.
08-05-2022 Update
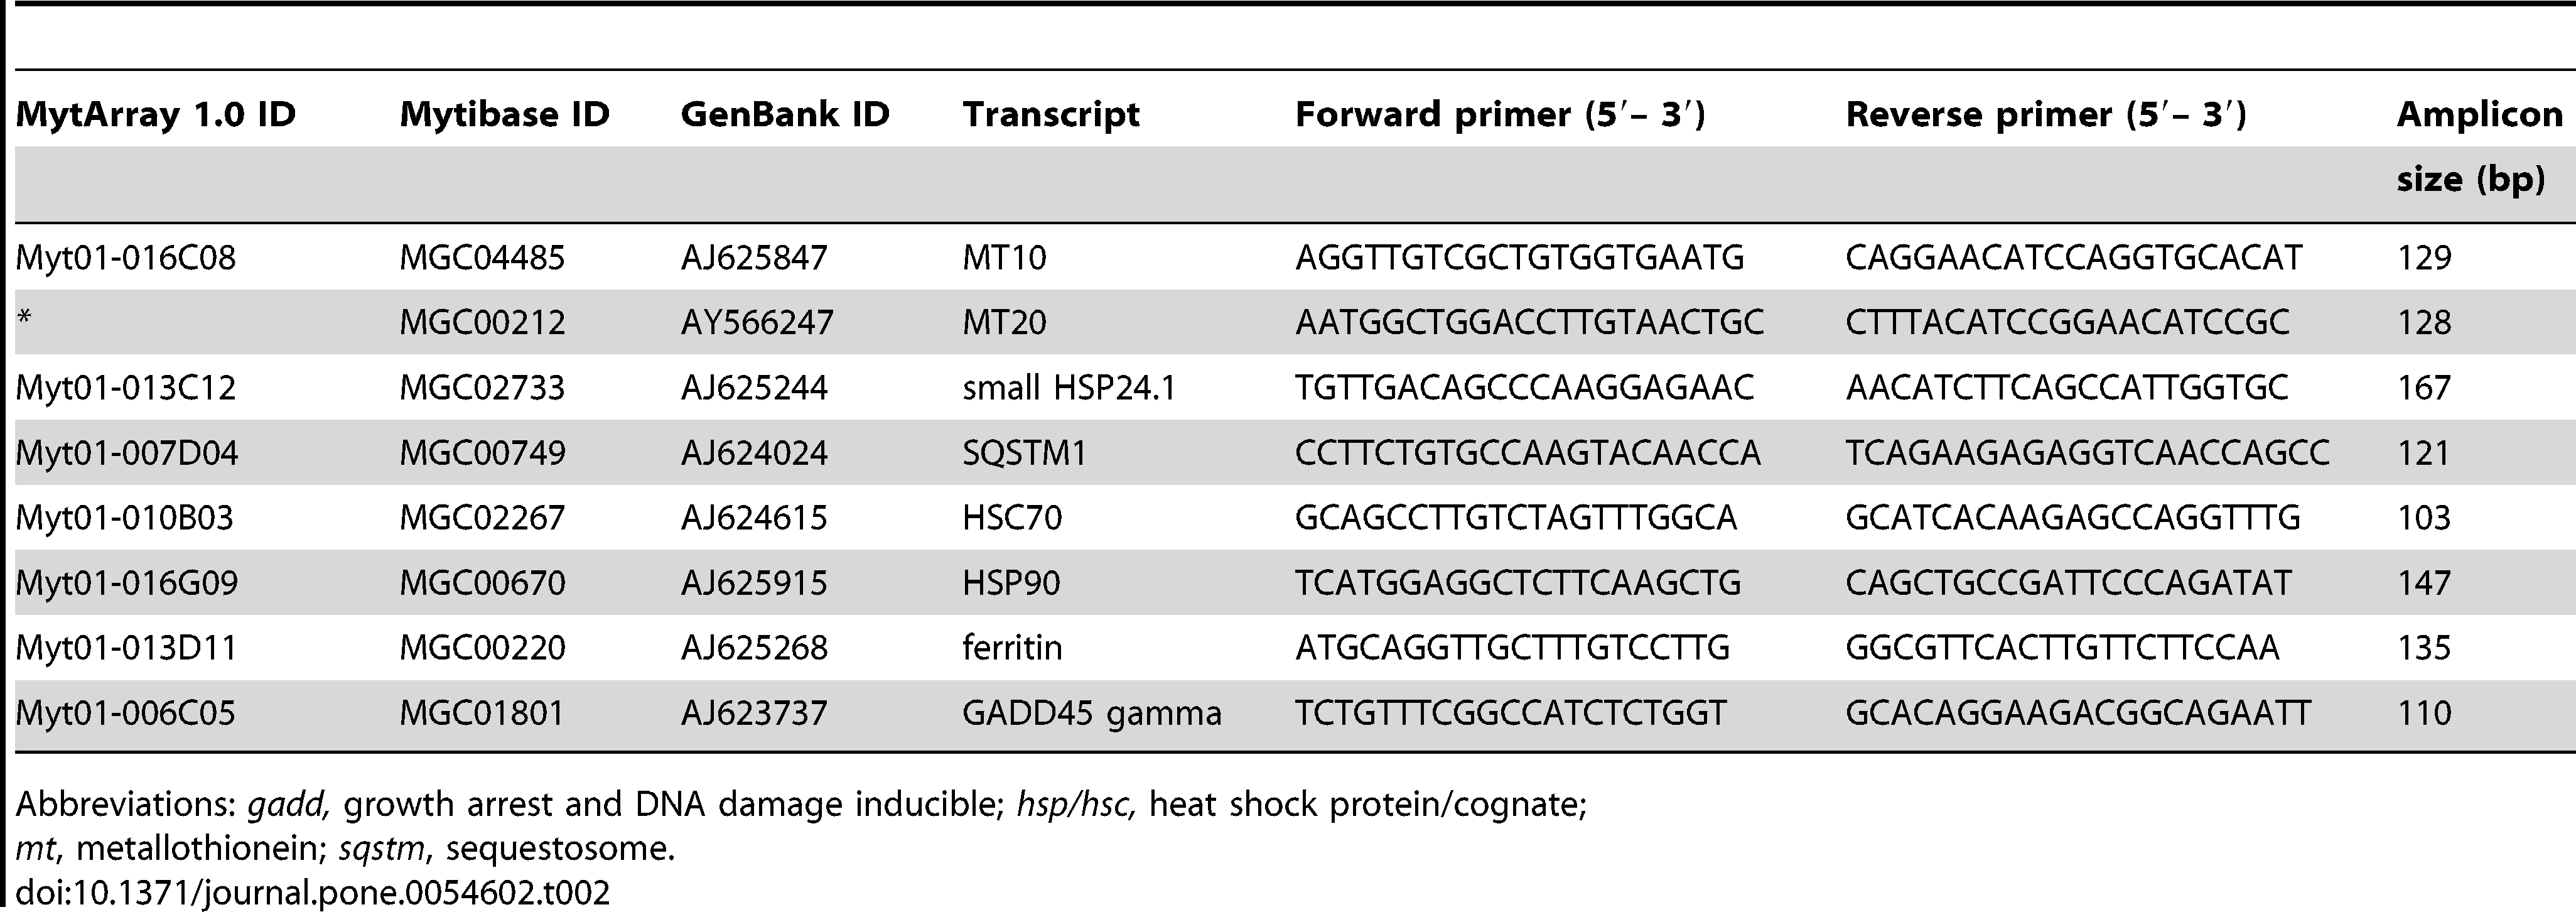
qPCR runs from Dorothy’s experiment showed successful amplification for all primers used in class except for ferritin. So I will likely re-rerun samples from class with the primers for MT10, MT20, small HSP24.1, SQSTM1, HSC70, HSP90, and GADD45 gamma.
Primers (will exclude ferritin):
08-12-2022 Update
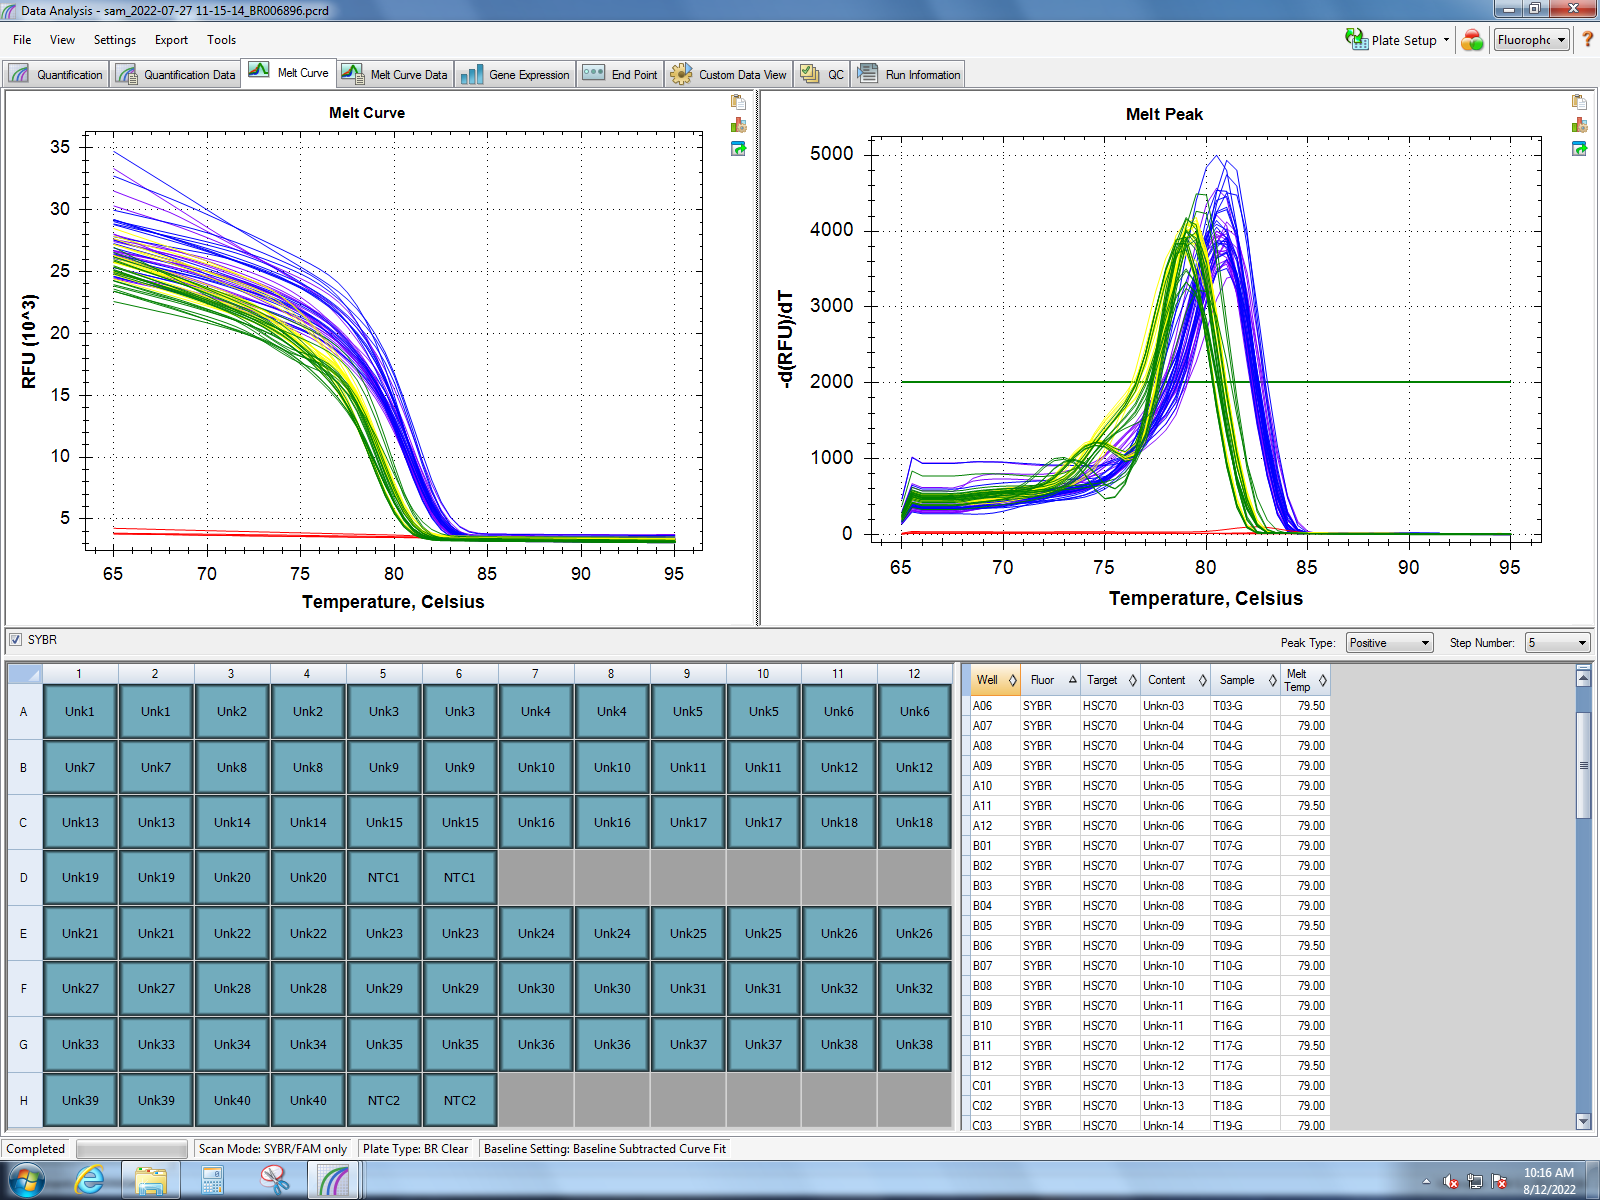
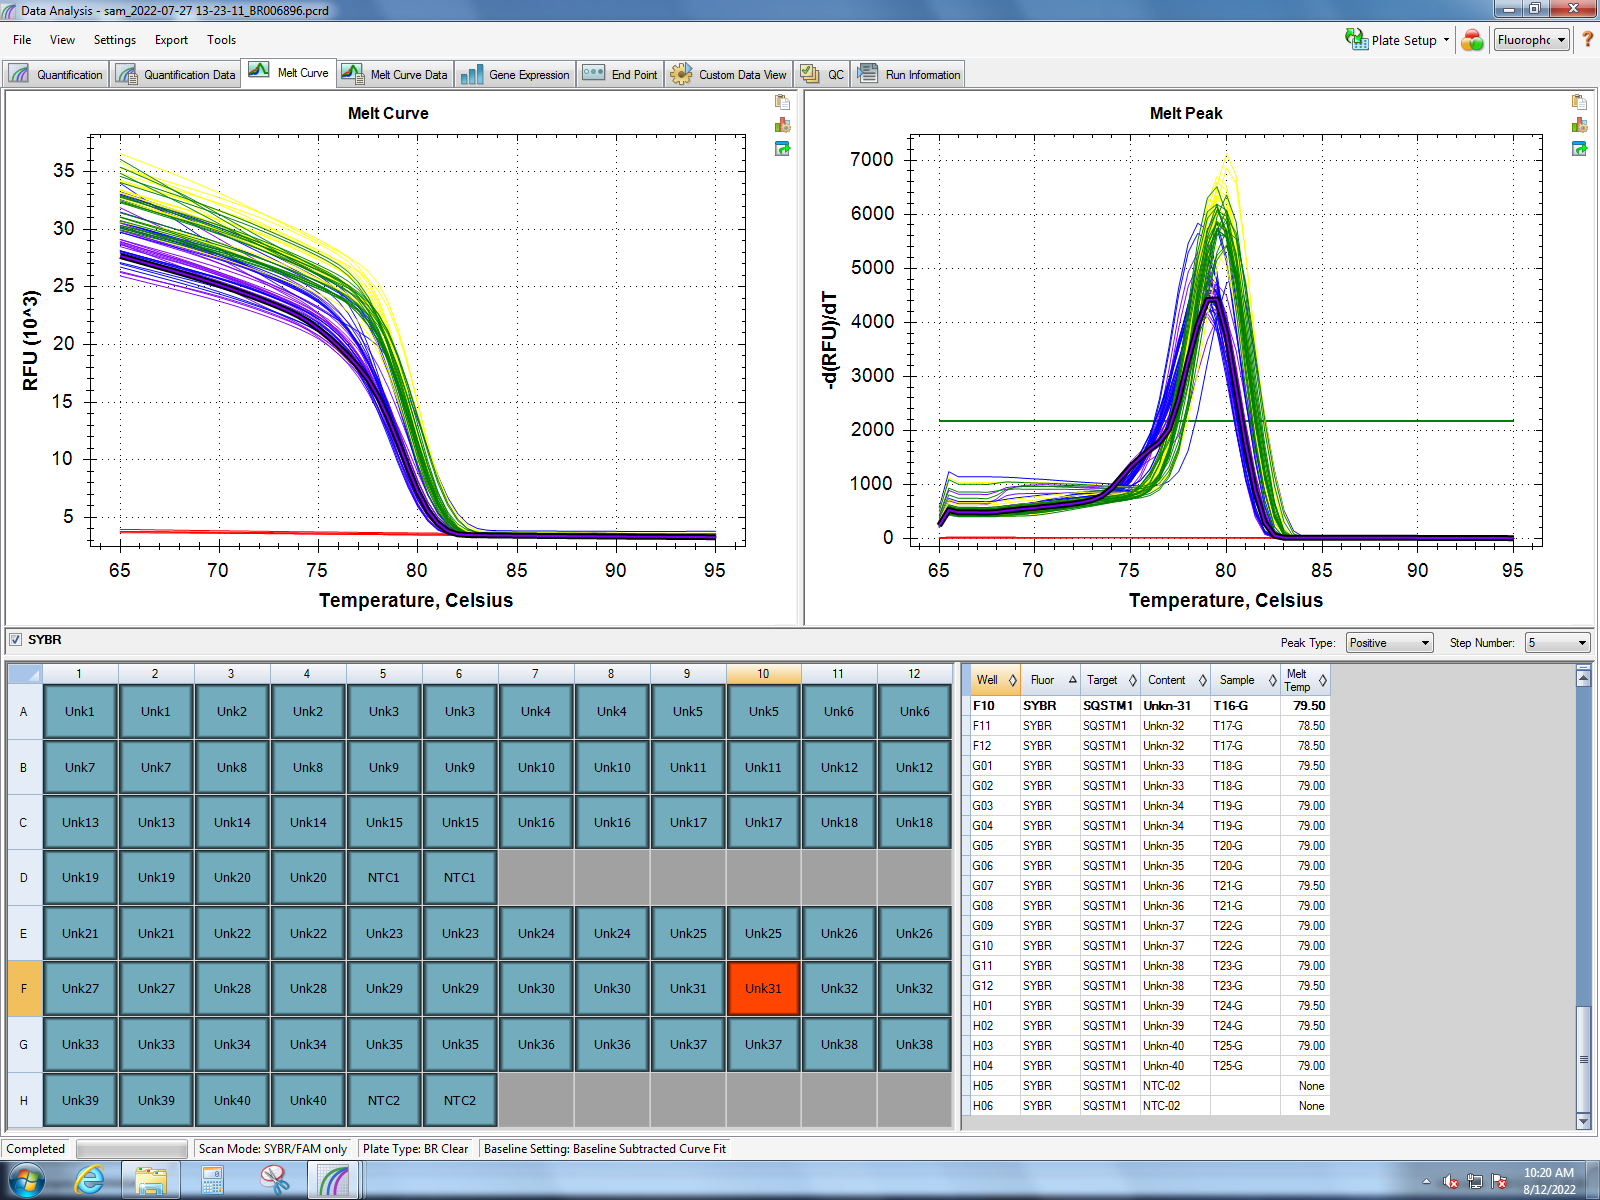
Melt curves from Dorothy’s experiment (1 hour of heat stress) show good amplification of MT10, MT20, small HSP24.1, SQSTM1, HSC70, HSP90, and GADD45 gamma. Her findings show the most significant response in small HSP24.1. Dorothy’s lab notebook can be found here.
HSC70 & small HSP24
HSP90 & SQSMT1
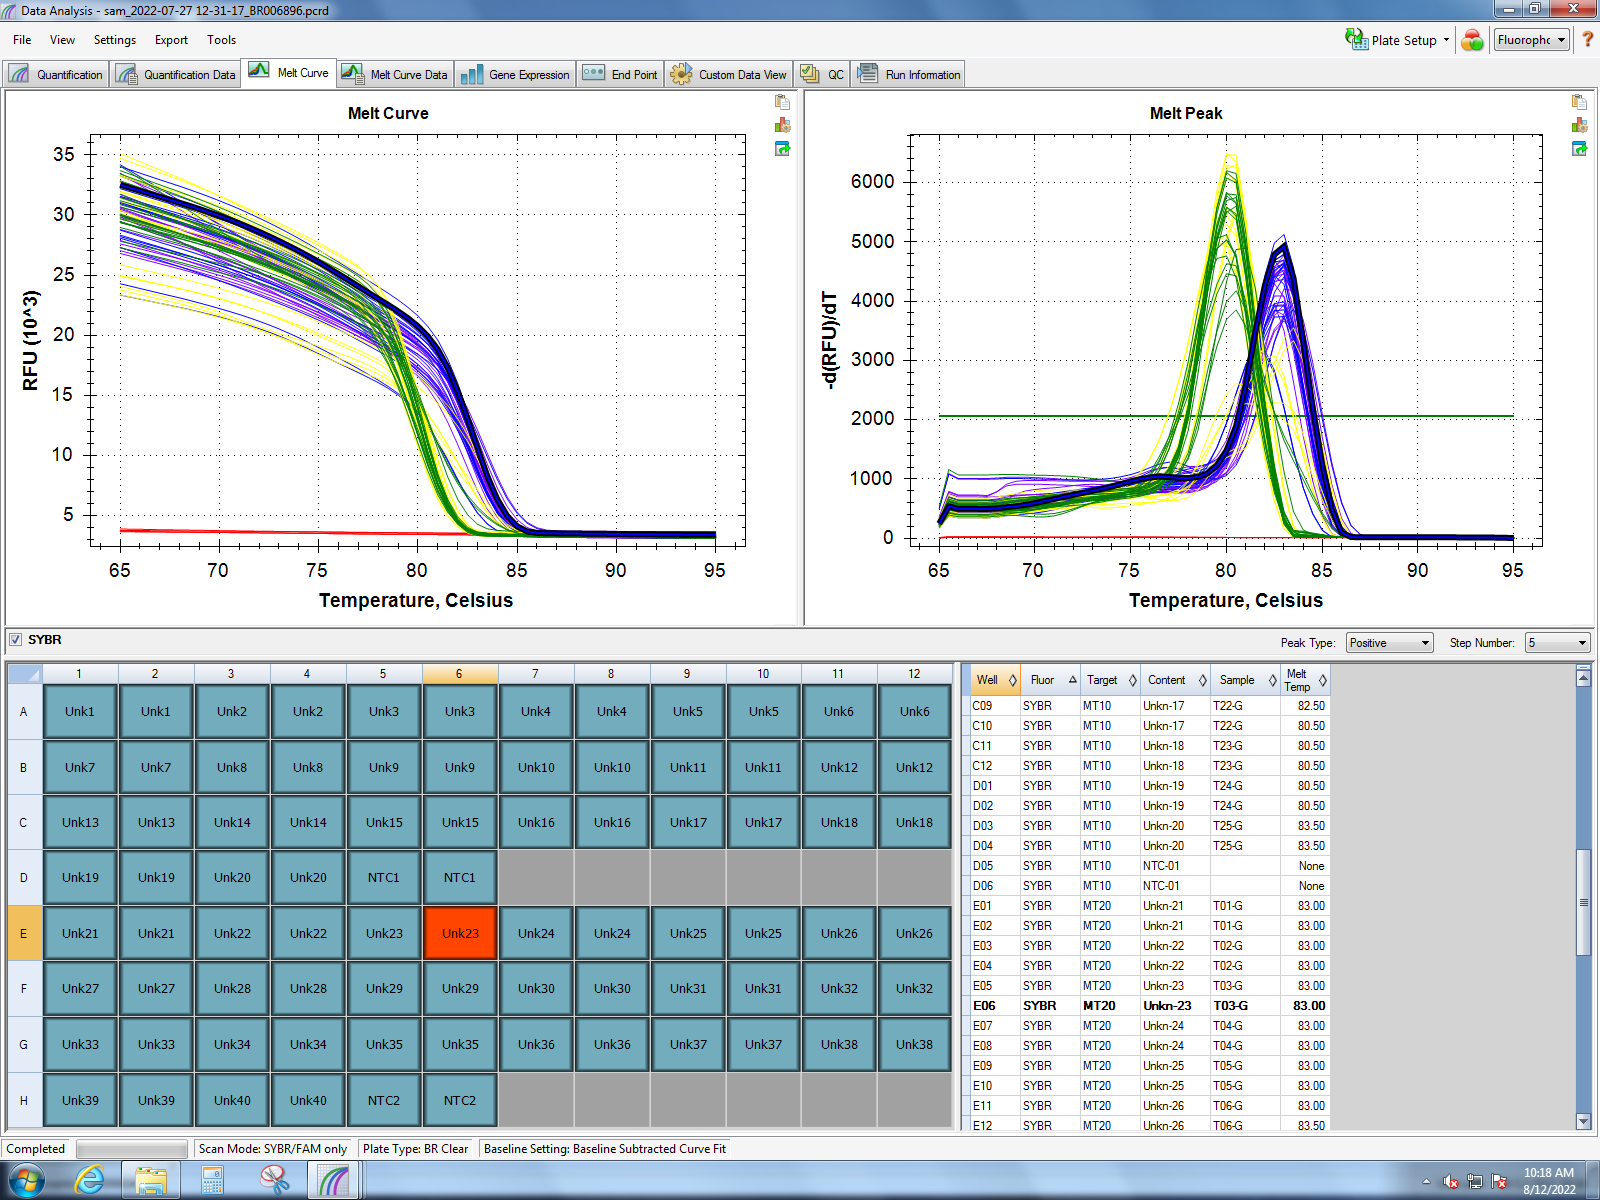
MT10 & MT20
GADD45 gamma
Ferritin
I will be running pPCR on existing cDNA from the class experiment using the small HSP24.1 primer.
08-18-2022 Update
We have 64 cDNA samples from experiment 2: replicates, A & B, for each individual (chronic heat of 18C, variable cycling heat 12C-18C, and control 12C). To run them with the HSP24 primer and for all subsequent analyses, I made 1:10 dilutions for each cDNA sample (40ul each, 4ul sample and 36ul DEPC H2O).
08-22-2022
Ran qPCR of A & B cDNA samples individually for HSP24. A & B are cDNA synthesis replicates (and A & B exist for each sample in Experiment 2).
08-31-2022 Update
Ran qPCR of pooled A & B cDNA samples for HSP24.
Melt Curve:
Amplification:
Melt curve shows potential primer-dimer and amplification in one of the NTCs. Standard deviations between replicates are suspiciously high.
09-08-2022 Update
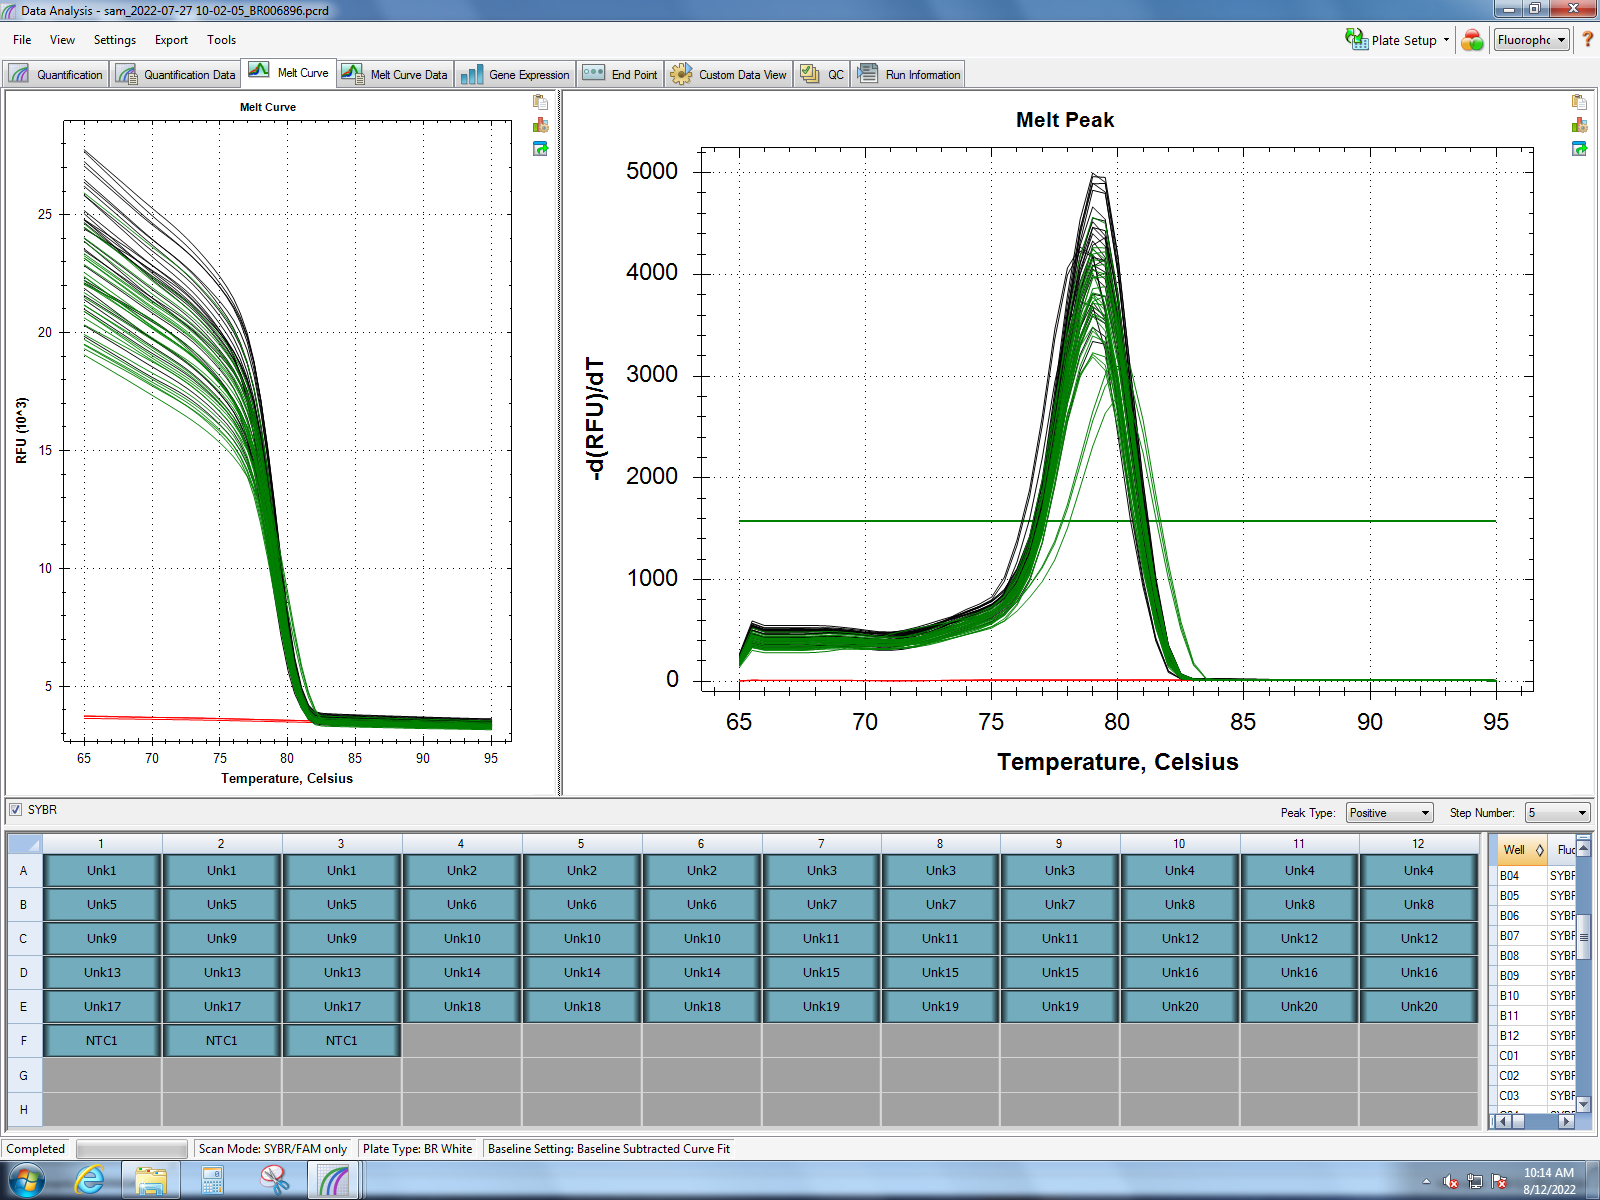
Ran qPCR of pooled A & B cDNA samples for HSP90.
Melt Curve:
Amplification:
Melt curves look good, no amplification in NTCs, and standard deviations between replicates look alright.
02-03-2023
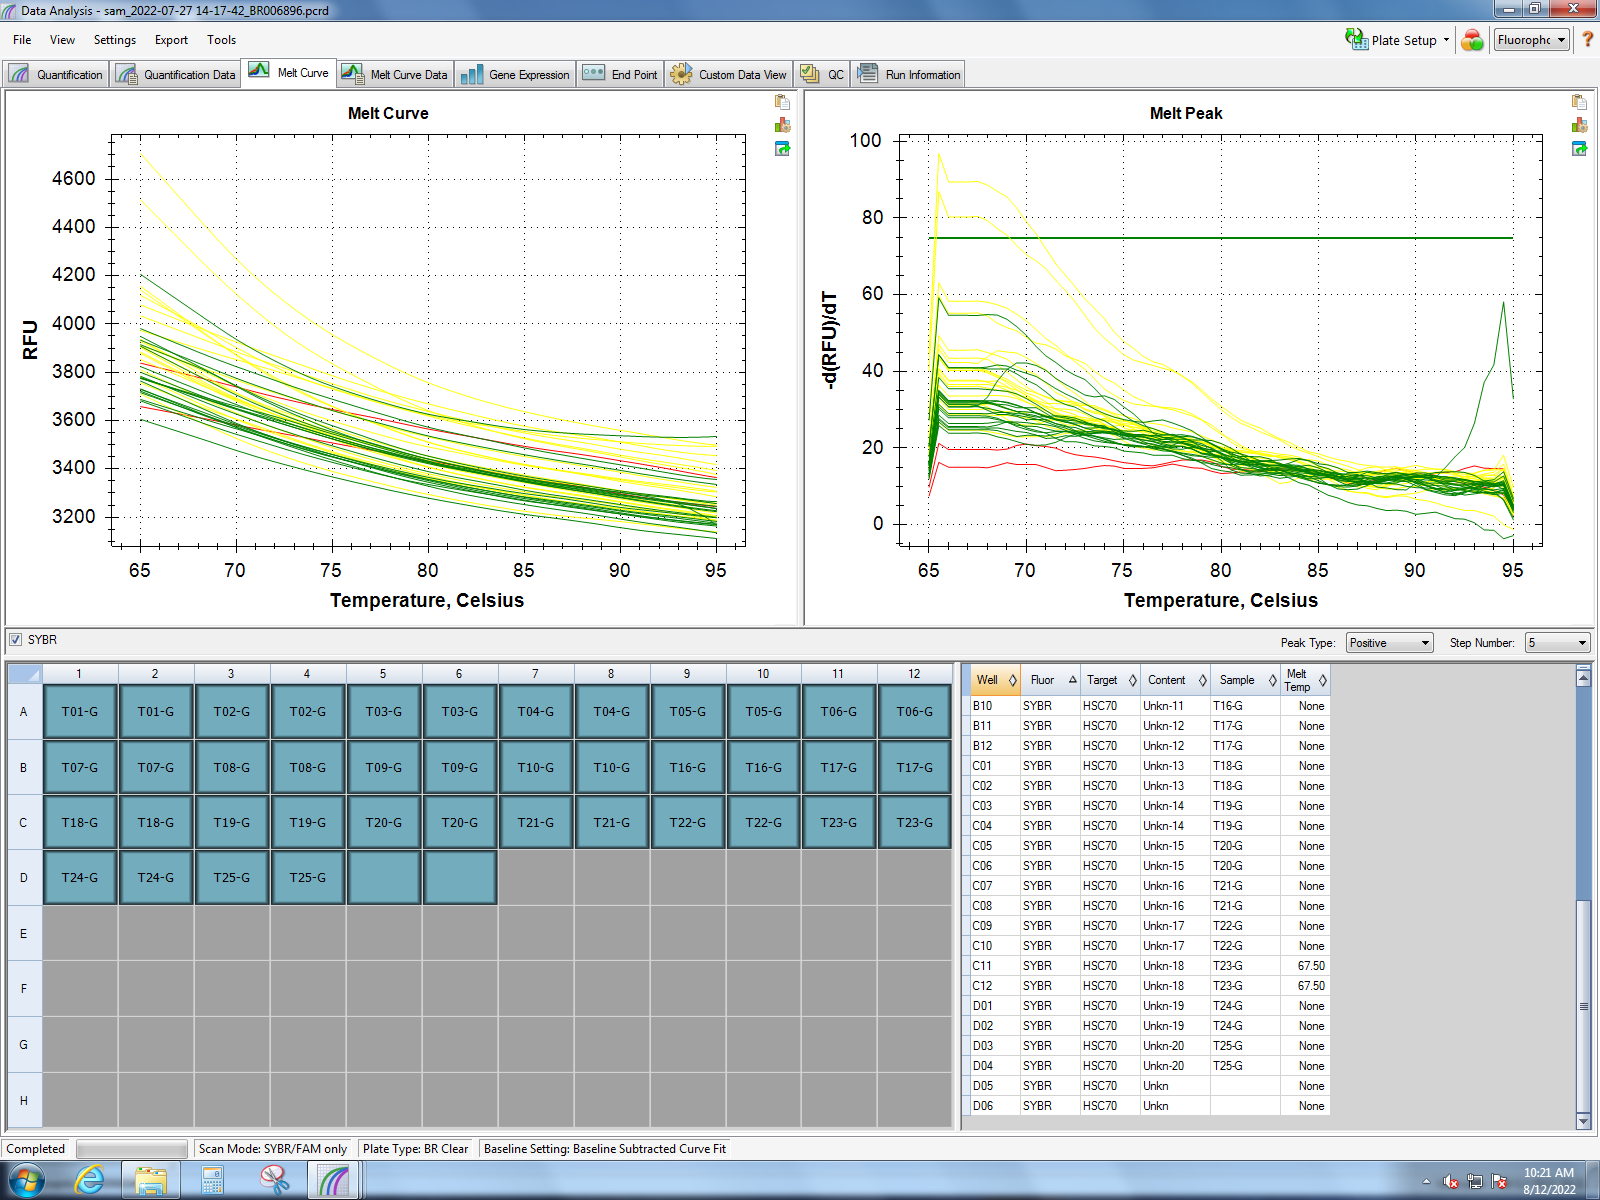
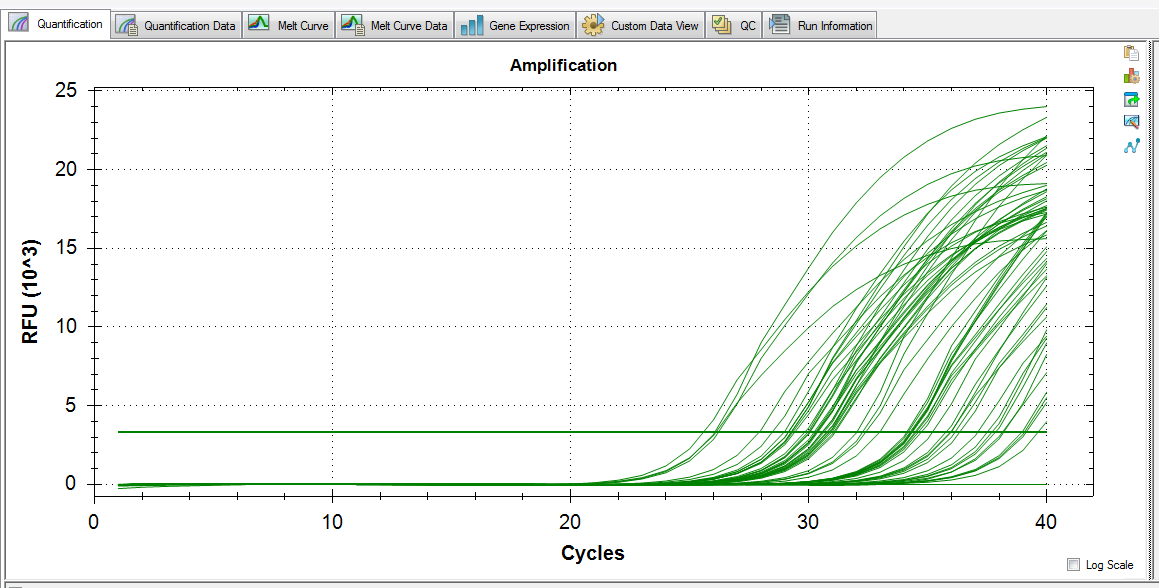
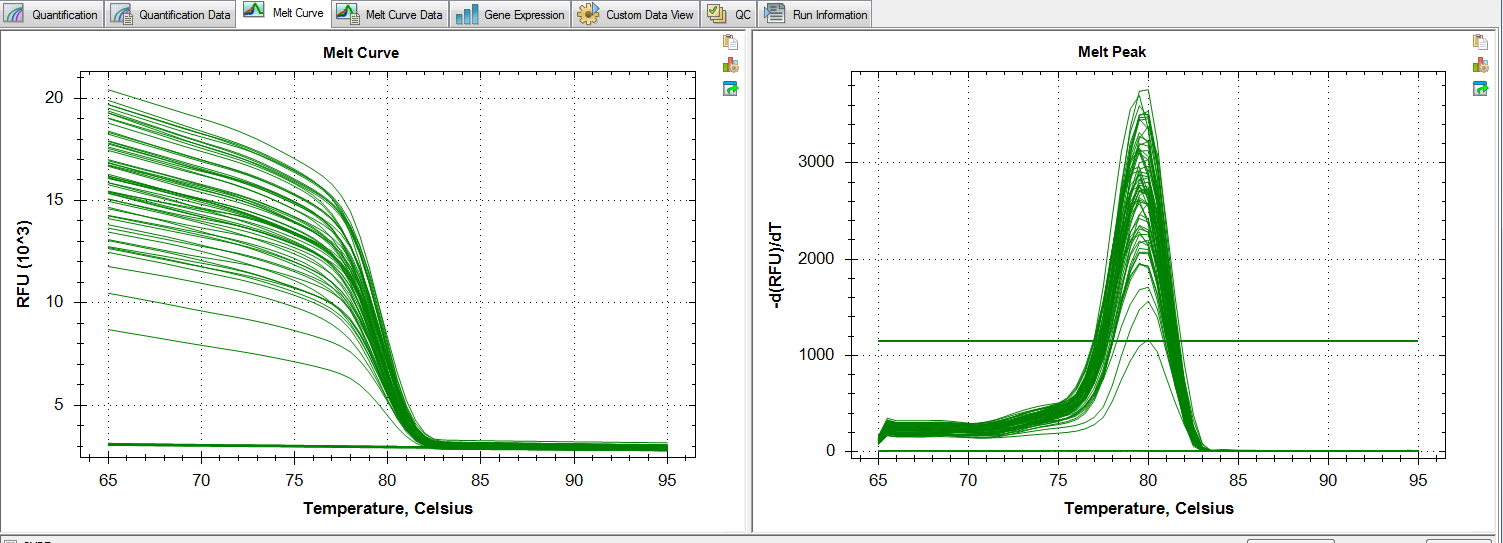
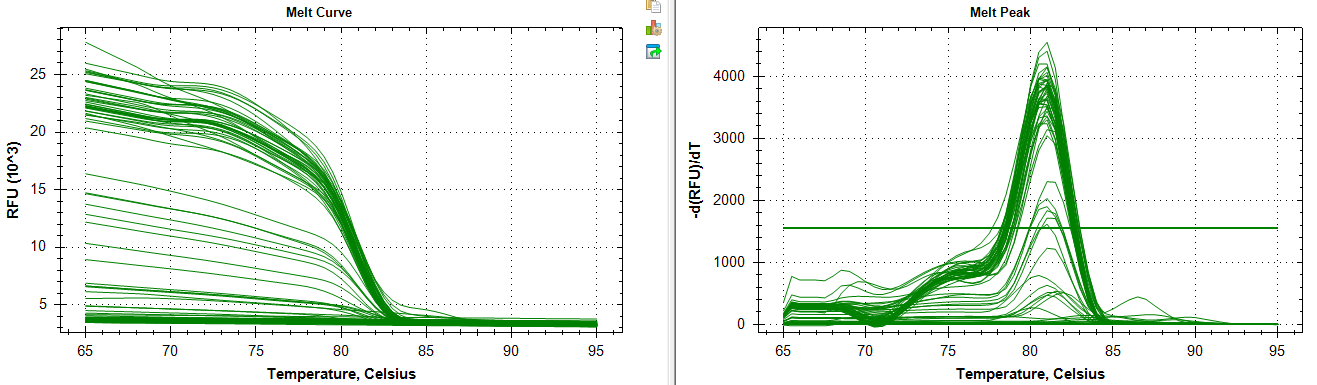
Ran qPCR of pooled A & B cDNA samples for HSC70.
Melt Curve:
Amplification:
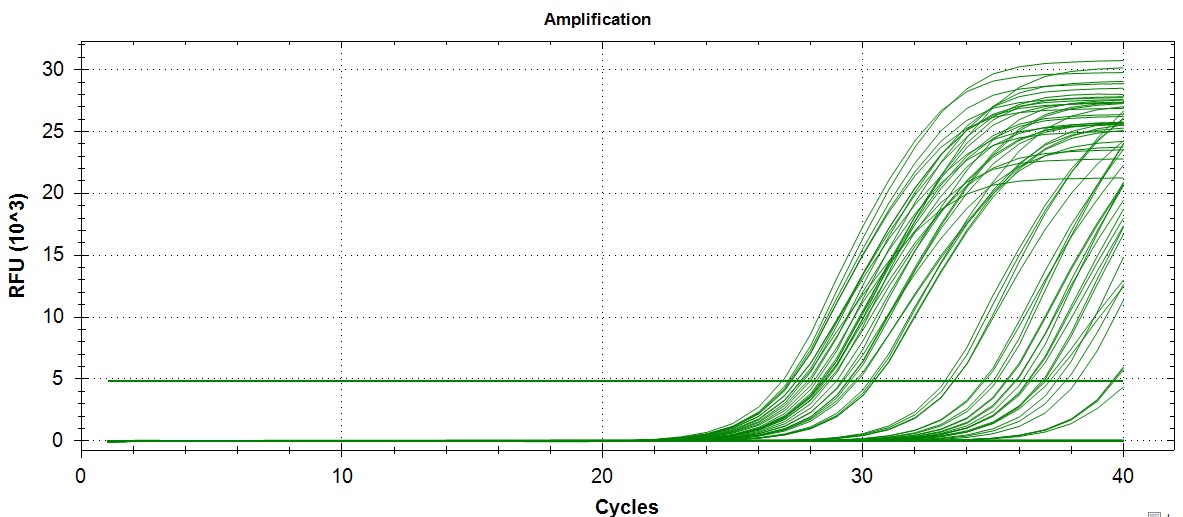
Amplification and melt curves look alright. But it looks like a few sample did not amplify past the threshold. Unsure if this is a lab error or true lack of expression.
Update 03-20-2023
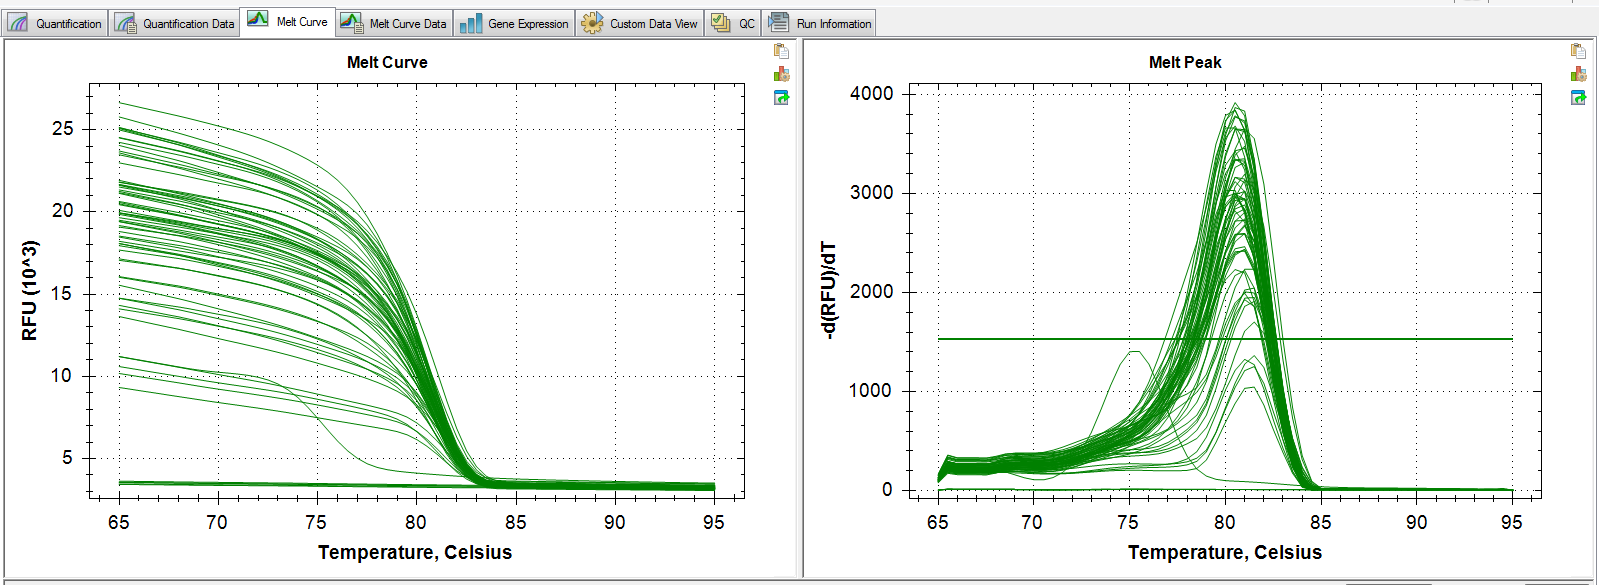
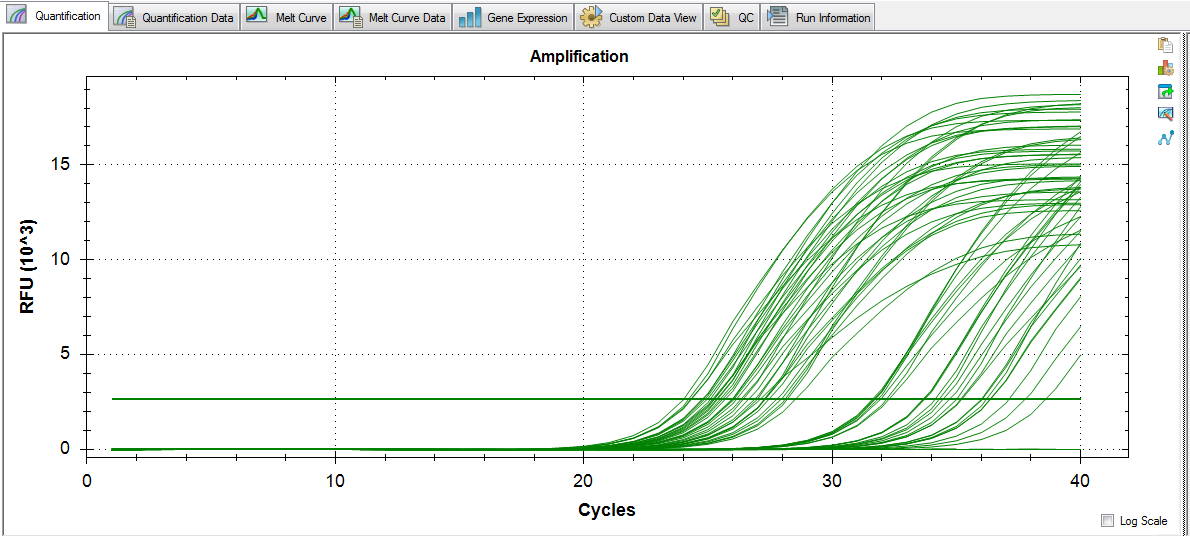
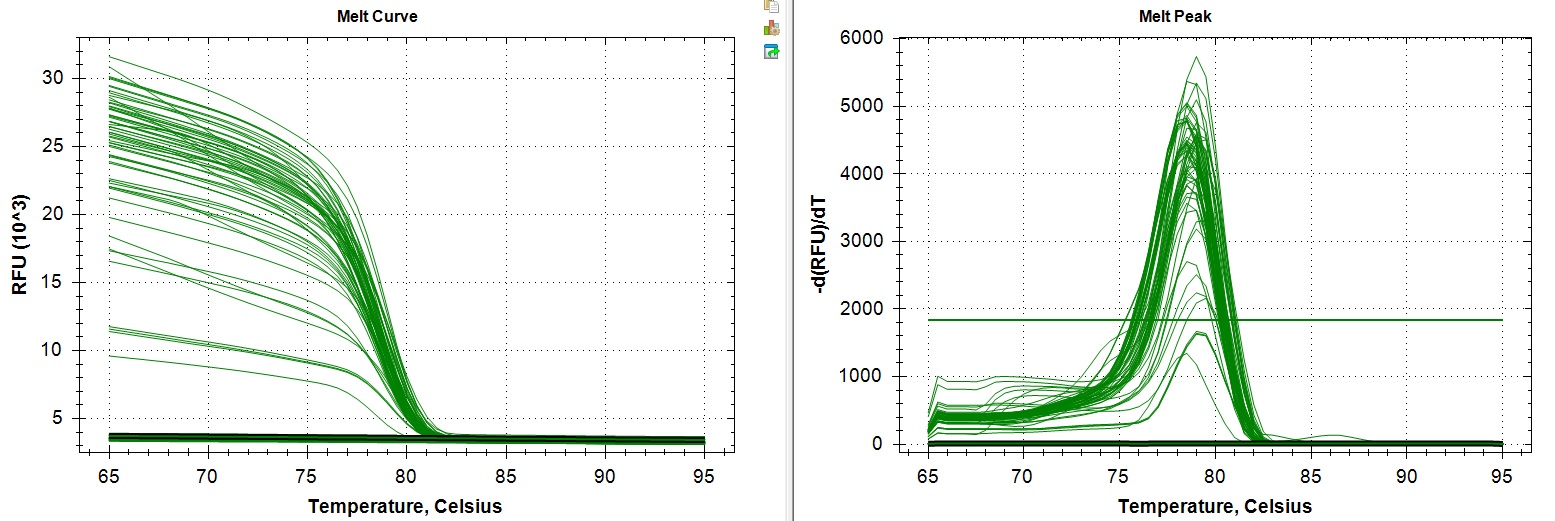
Ran qPCR of pooled for Actin (the chosen normalizing gene).
Melt Curve:
Amplification:
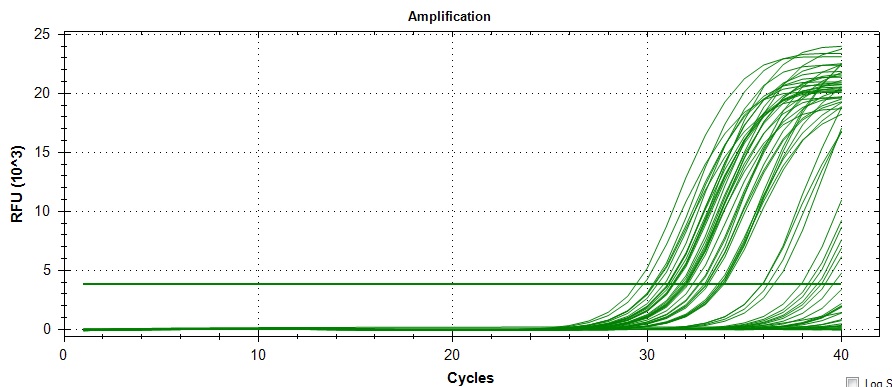
Amplification and melt curves look alright, but their may be some unintended amplification. Definitely appears to be a loading error for controls 96-99. I have another Actin primer in mind if necessary.
Update 03-22-2023
Compiled Cq and Cq Mean here
to be continued…