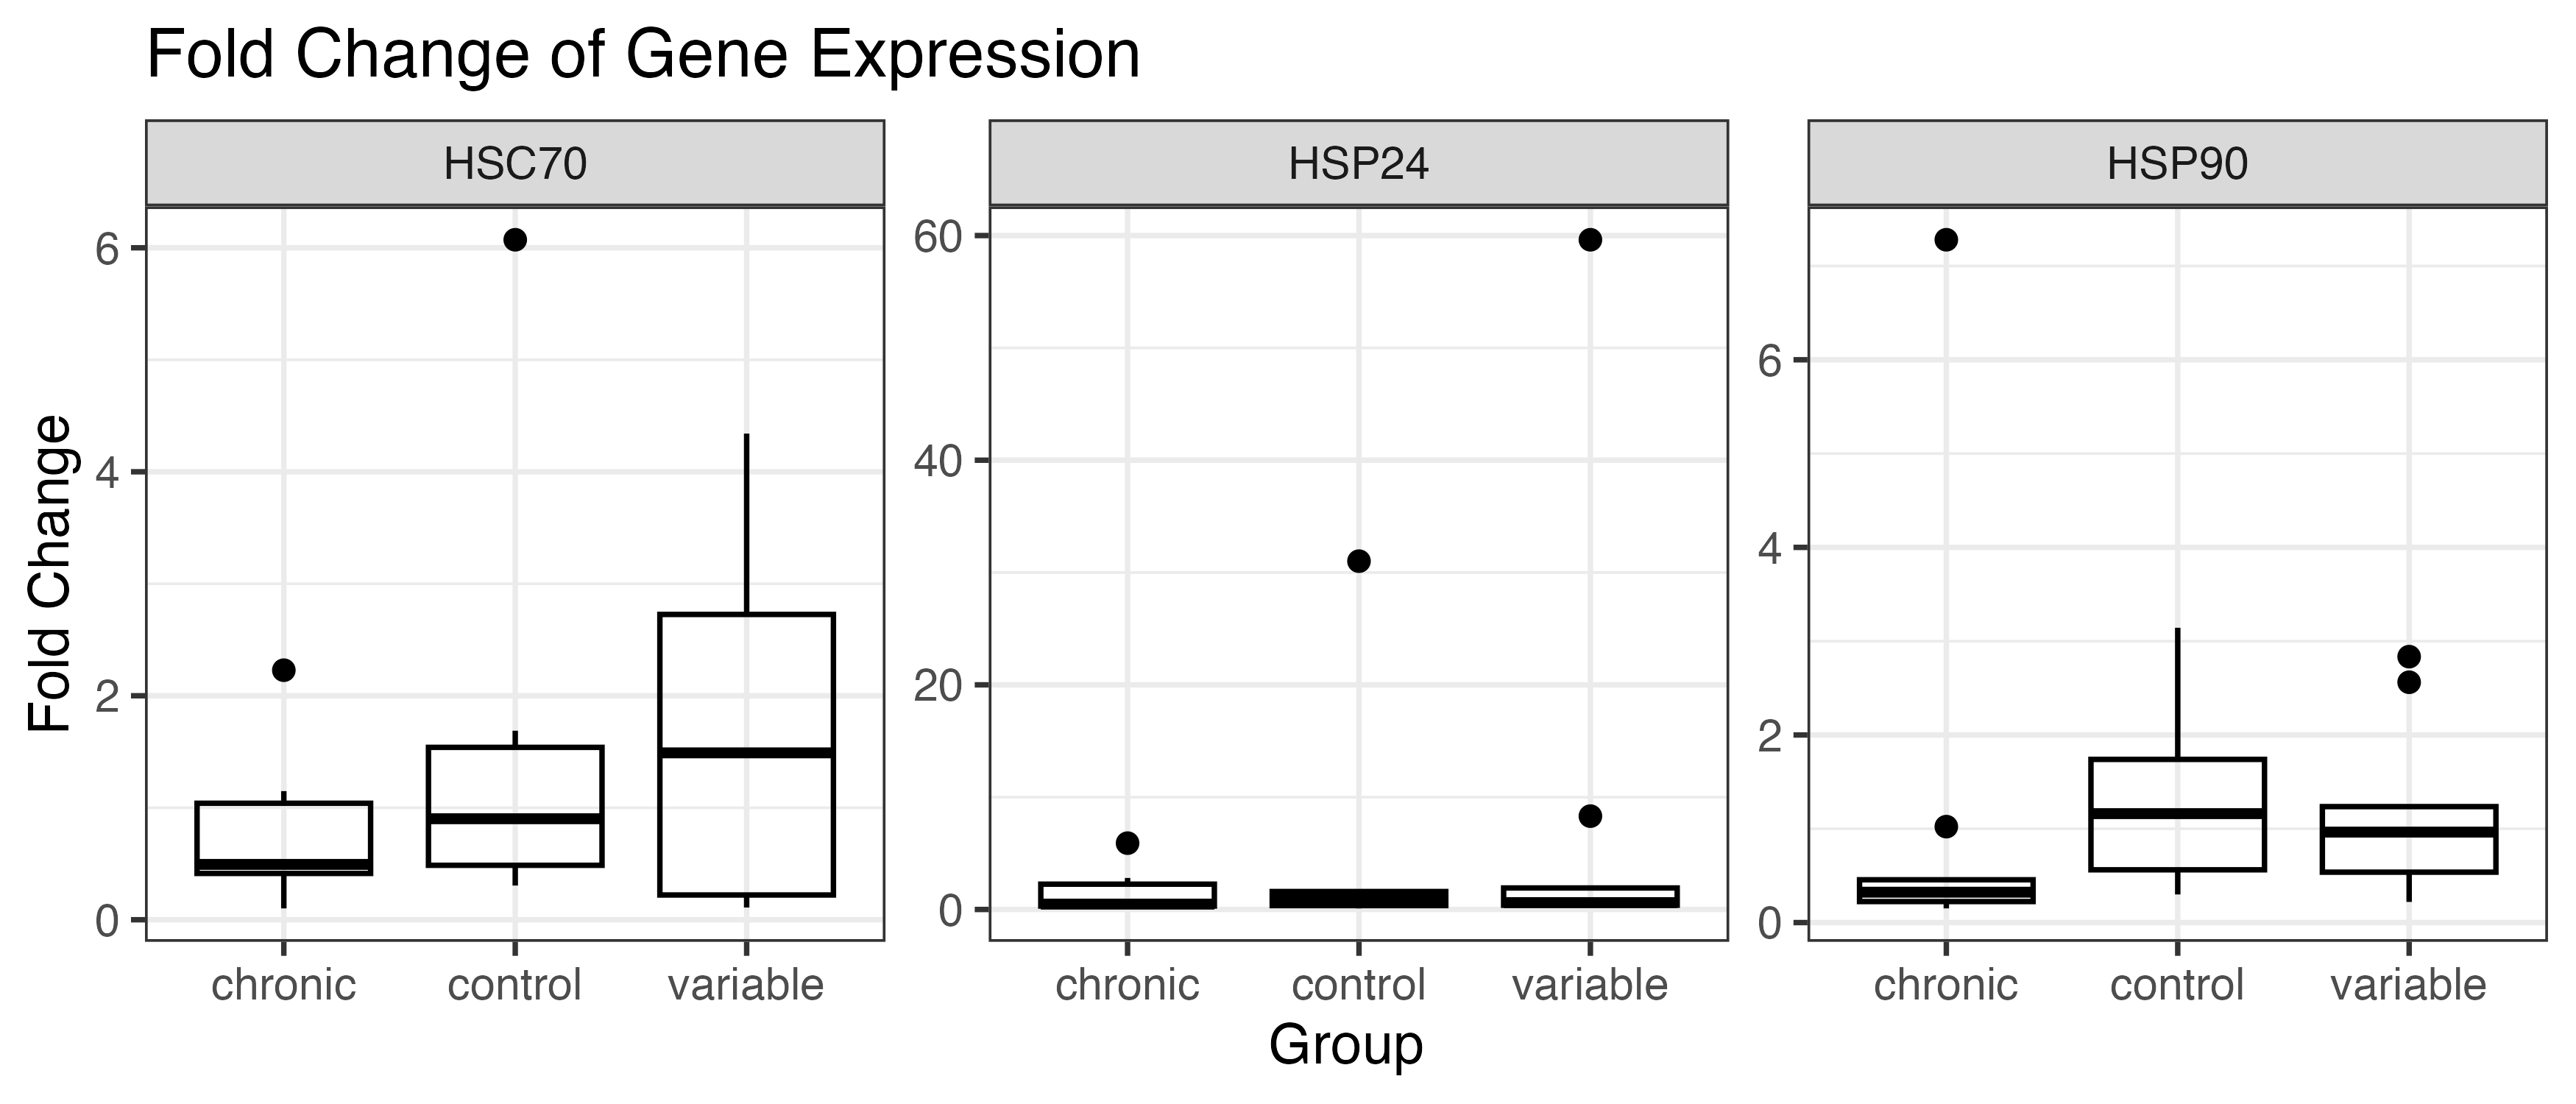
Boxplot with outliers:
Boxplot without outliers:
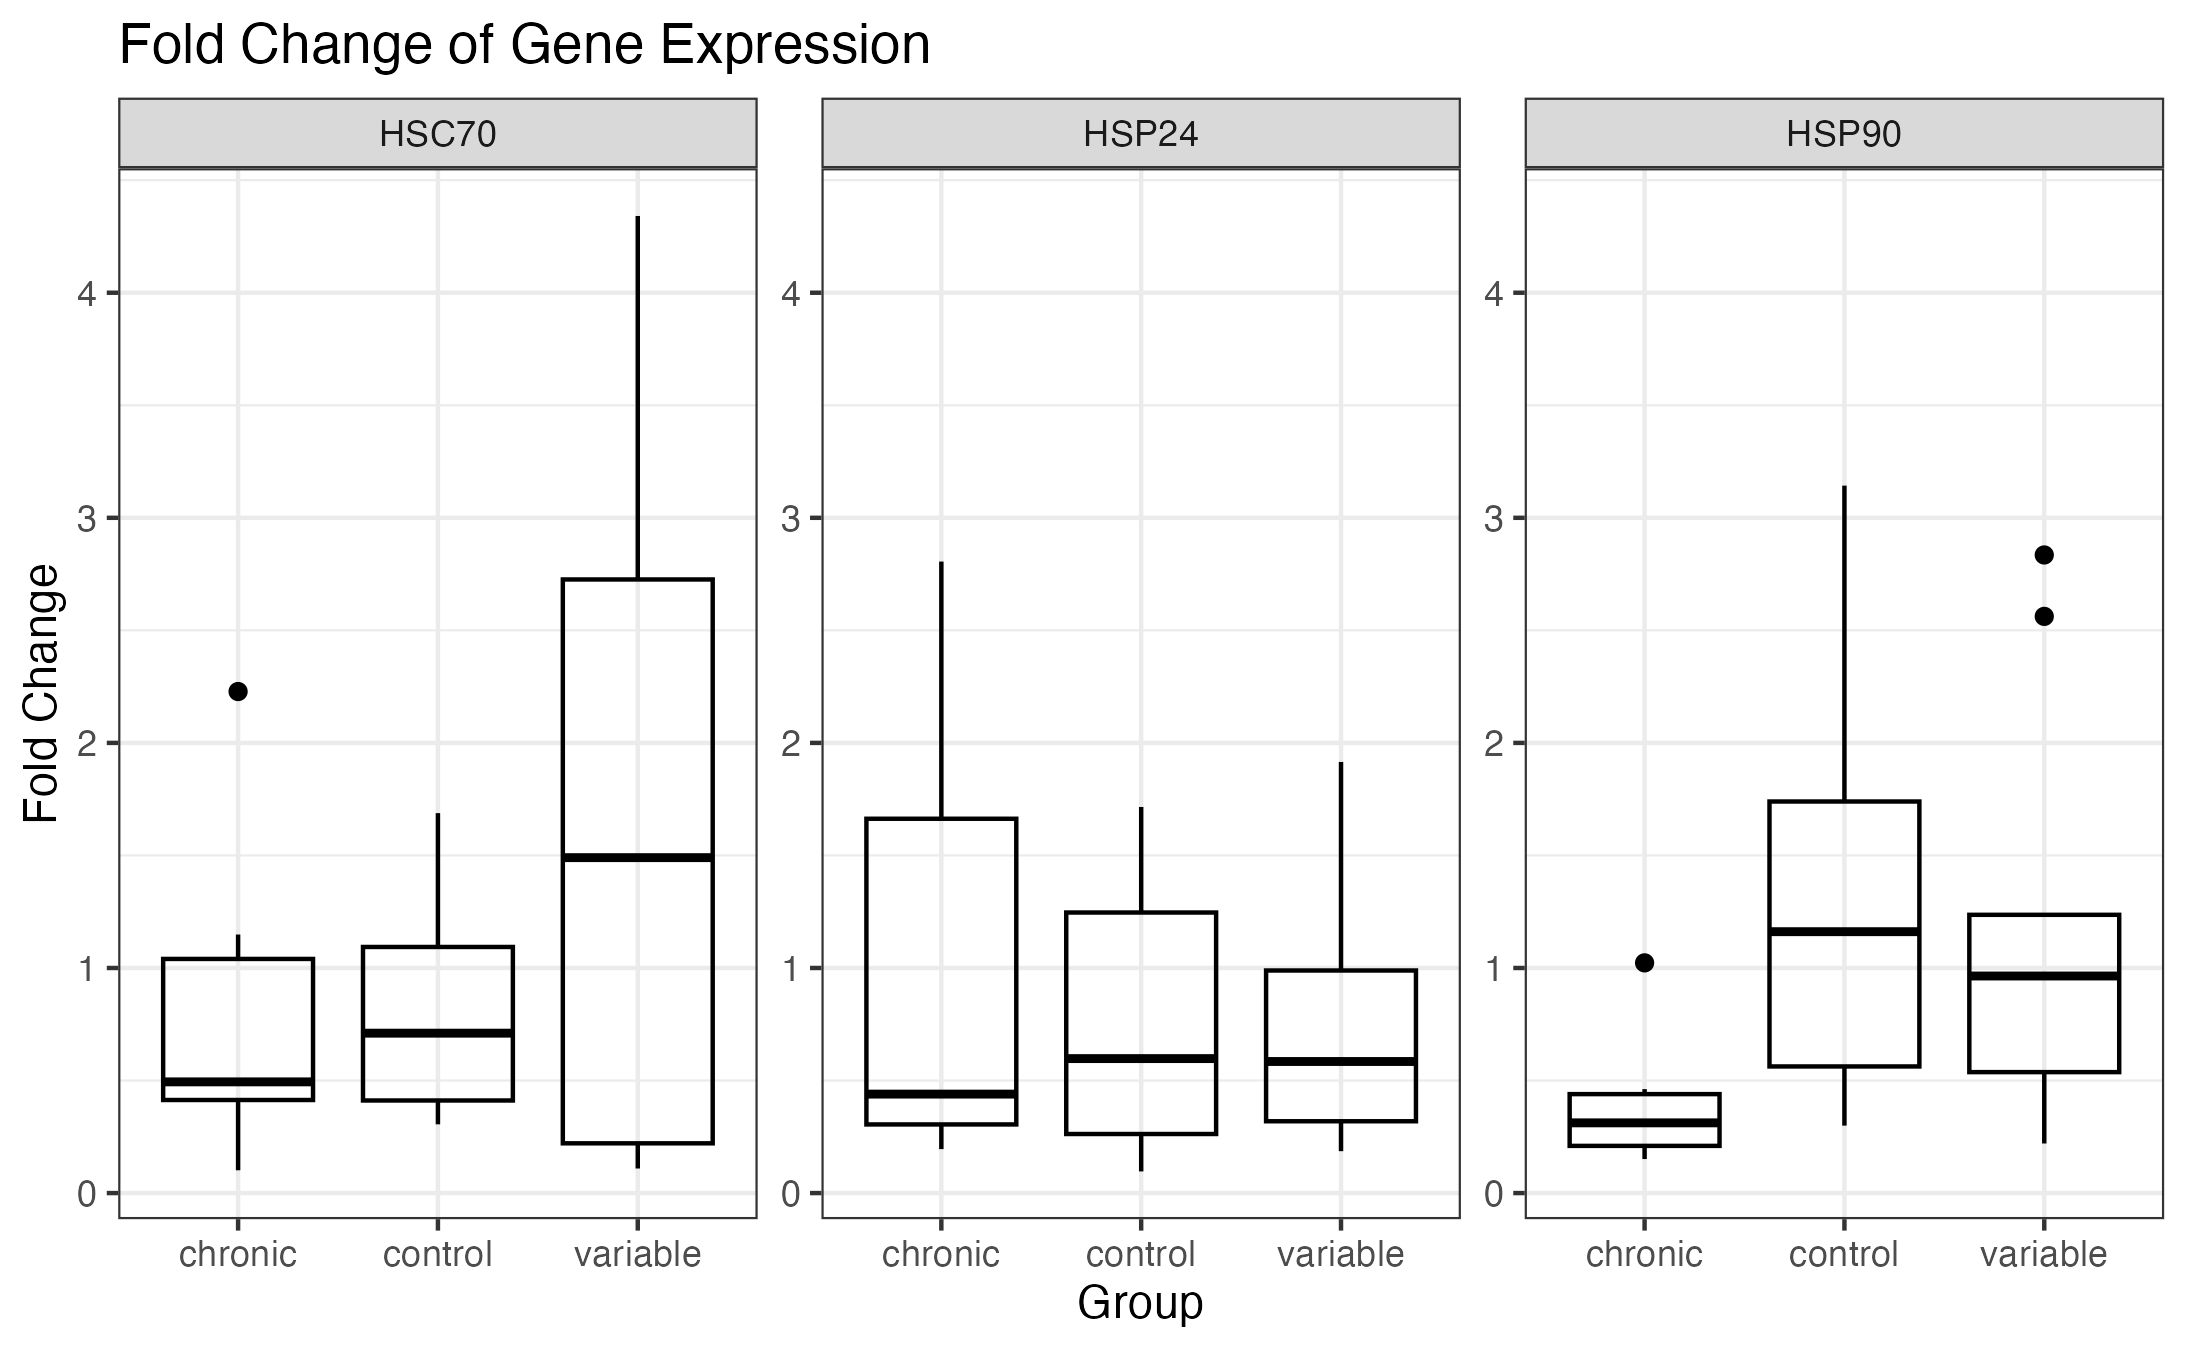
Used a standard method in ggplot2 for outlier removal: Whiskers for each gene and group are calculated using the boxplot.stats() function. Upper whisker is defined as the maximum value that is less than or equal to 1.5 times the interquartile range (IQR) above the third quartile, and the lower whisker is defined as the minimum value that is greater than or equal to 1.5 times the IQR below the first quartile.
Used delta delta Ct analysis to obtain fold change which is how much of a difference in expression exists in your treatment compared to the control. So a “2” for a chronic sample would be 200% as much gene expression as in the control overall. I calculated detla delta Ct by subtracting the normalizing gene Ct from each sample Ct and then subtracting the average Ct of the control group from this number. Then used the formula 2^(-deltadeltaCt).
Code
knitr::opts_chunk$set(echo = TRUE)
### import the compiled Cq data
qpcr_data <- read.csv("/Users/zachbengtsson/Desktop/Mussel Heat qPCR/Cq_Compiled_v2.csv", header = TRUE)
### calc delta Ct (GOI - NG)
qpcr_data$delta_ct_HSP24 <- qpcr_data$HSP24CqMean - qpcr_data$ACTCqMean
qpcr_data$delta_ct_HSC70 <- qpcr_data$HSC70CqMean - qpcr_data$ACTCqMean
qpcr_data$delta_ct_HSP90 <- qpcr_data$HSP90CqMean - qpcr_data$ACTCqMean
### Calc delta delta Ct (Subtracting Average delta Ct of control from each)
# Calculate the average delta Ct value for the control group
control_mean_delta_ct_HSP24 <- mean(qpcr_data[qpcr_data$Biological.Set.Name == "control", "delta_ct_HSP24"])
control_mean_delta_ct_HSC70 <- mean(qpcr_data[qpcr_data$Biological.Set.Name == "control", "delta_ct_HSC70"])
control_mean_delta_ct_HSP90 <- mean(qpcr_data[qpcr_data$Biological.Set.Name == "control", "delta_ct_HSP90"])

# Calculate the delta delta Ct value for each sample
qpcr_data$delta_delta_ct_HSP24 <- qpcr_data$delta_ct_HSP24 - control_mean_delta_ct_HSP24
qpcr_data$delta_delta_ct_HSC70 <- qpcr_data$delta_ct_HSC70 - control_mean_delta_ct_HSC70
qpcr_data$delta_delta_ct_HSP90 <- qpcr_data$delta_ct_HSP90 - control_mean_delta_ct_HSP90
### Calc the fold change (2^(-delta delta Ct))
qpcr_data$fold_change_HSP24 <- 2^(-qpcr_data$delta_delta_ct_HSP24)
qpcr_data$fold_change_HSC70 <- 2^(-qpcr_data$delta_delta_ct_HSC70)
qpcr_data$fold_change_HSP90 <- 2^(-qpcr_data$delta_delta_ct_HSP90)
library(ggplot2)
library(tidyr)
library(dplyr)
### Create data frame for boxplots
fold_change_data <- data.frame(
  group = qpcr_data$Biological.Set.Name,
  fold_change_HSP24 = qpcr_data$fold_change_HSP24,
  fold_change_HSC70 = qpcr_data$fold_change_HSC70,
  fold_change_HSP90 = qpcr_data$fold_change_HSP90
)
### Reshape with tidy gather() function
fold_change_data <- fold_change_data %>%
  gather(key = "gene", value = "fold_change", -group)
ggplot(fold_change_data, aes(x = group, y = fold_change)) +
  geom_boxplot(fill = "transparent", color = "black") +
  facet_wrap(~ gene, scales = "free_y", strip.position = "top",
             labeller = labeller(gene = c(fold_change_HSC70 = "HSC70", fold_change_HSP24 = "HSP24", fold_change_HSP90 = "HSP90"))) +
  xlab("Group") +
  ylab("Fold Change") +
  ggtitle("Fold Change of Gene Expression") +
  theme_bw()
ggsave("boxplot_withOutliers.png", width = 4, height = 3, dpi = 500)
# Calculate upper and lower whiskers for each gene and group
whiskers <- fold_change_data %>%
  group_by(group, gene) %>%
  summarize(
    lower_whisker = boxplot.stats(fold_change)$stats[1],
    upper_whisker = boxplot.stats(fold_change)$stats[5]
  )
### Whiskers for each gene and group are calculated using the boxplot.stats() function. Upper whisker is defined as the maximum value that is less than or equal to 1.5 times the interquartile range (IQR) above the third quartile, and the lower whisker is defined as the minimum value that is greater than or equal to 1.5 times the IQR below the first quartile.

# Create the plot and exclude outliers
ggplot(fold_change_data, aes(x = group, y = fold_change)) +
  geom_boxplot(fill = "transparent", color = "black") +
  facet_wrap(~ gene, scales = "free_y", strip.position = "top",
             labeller = labeller(gene = c(fold_change_HSC70 = "HSC70", fold_change_HSP24 = "HSP24", fold_change_HSP90 = "HSP90"))) +
  xlab("Group") +
  ylab("Fold Change") +
  ggtitle("Fold Change of Gene Expression") +
  theme_bw() +
  scale_y_continuous(limits = c(min(whiskers$lower_whisker), max(whiskers$upper_whisker)))

ggsave("boxplot_removeOutliers.png", width = 4, height = 3, dpi = 500)